Showing posts with label Violent Crime. Show all posts

Wednesday, May 30, 2018

The Low Degree of Violence in U.S. - Mexican Border Cities

U.S.-Mexican border cities have been experiencing a historically low rate of violent crimes, at least through 2016, the most recent year with statistics available from the FBI's Uniform Crime Reports.

In my previous analyses, I looked at the recent rate of violent crimes versus the peak year. In that study I used statistics through 2014 which were the most recent numbers compiled into the city tables. Since then I discovered that the 2015 and 2016 annual reports included information for major cities.

So: this post includes the years 2015 and 2016 and rather than look at single year peaks, I compared the peak five consecutive years to the most recent five consecutive years. Being a different analysis, and less reliant on single year peaks, the numbers come out a bit differently, and are less prone to error.

To be clear: these data, the most recent available, represent crime through the end of the Obama administration and this is not a commentary on subsequent changes.

The five cities chosen were those U.S. cities that had over 100,000 in population and which border Mexico: Brownsville, McAllen, Laredo, El Paso, all in Texas, and San Diego, in California. The statistics used were total violent crime rates, murder rates and the rate of rapes, available in the FBI city tables beginning with the year 1985.

Of the cities/measurements, all 15 show lower crime rates in recent years: in most cases, dramatically lower.

Brownsville Violent Crimes. Down by 76.5%
" " Murders. Down by 88.3%
" " Rape. Down by 49.1%

McAllen Violent Crimes. Down by 83.2%
" " Murders. Down by 67.6%
" " Rape. Down by 68.8%
 
Laredo Violent Crimes. Down by 37.7%
" " Murders. Down by 75.7%
" " Rape. Down by 6.1%

While all other city statistics show a 30% drop or more, rapes in Laredo had a negligible drop.

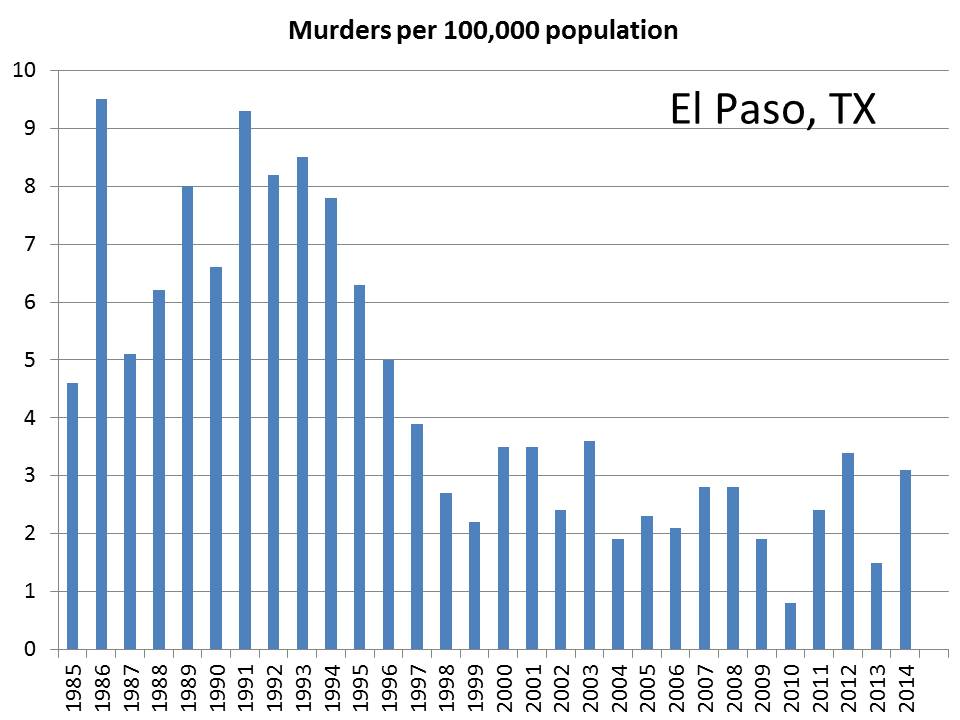
El Paso Violent Crimes. Down by 64.0%
" " Murders. Down by 68.1%
" " Rape. Down by 33.7%


San Diego Violent Crimes. Down by 66.7%
" " Murders. Down by 76.9%
" " Rape. Down by 32.8%

United States. Violent Crimes. Down by 49.3%
" " Murders. Down by 48.6%
" " Rape. Down by 33.7%

Four out of five of the border cities had violent crimes drop at a greater rate than the U.S. as a whole. Five out of five had murder drop at a greater (much greater) rate than the U.S. as a whole. Three out of five of the cities did equal or better in improving their rape statistics. (El Paso tied, San Diego less than one percent behind, and Laredo not doing well.) In total, according to the metrics, the border cities outperformed the U.S. as a whole in 11 out of 15 measures, with one tie.

So, here are the graphs.

Brownsville.


Brownsville, Violent Crimes per 100,000 population. The pink bar represents the average crime rate in the city's peak years of violent crime, which are shown individually in the leftmost bars. The green bar is the average for the five most recent years. FBI UCR statistics are compiled back to 1985.
------------
Brownsville Murder Rates. The legend corresponds to the one described above.
----------
Brownsville, Rate of Rape.
----------

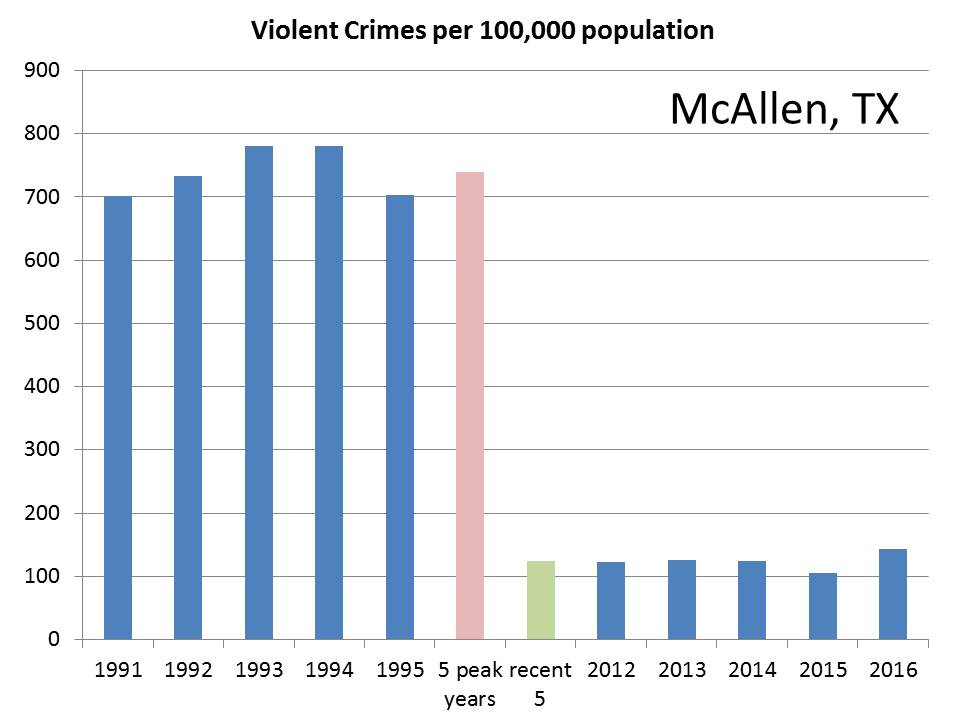
McAllen, Violent Crime Rate.
---------
McAllen, Murder Rate.
--------

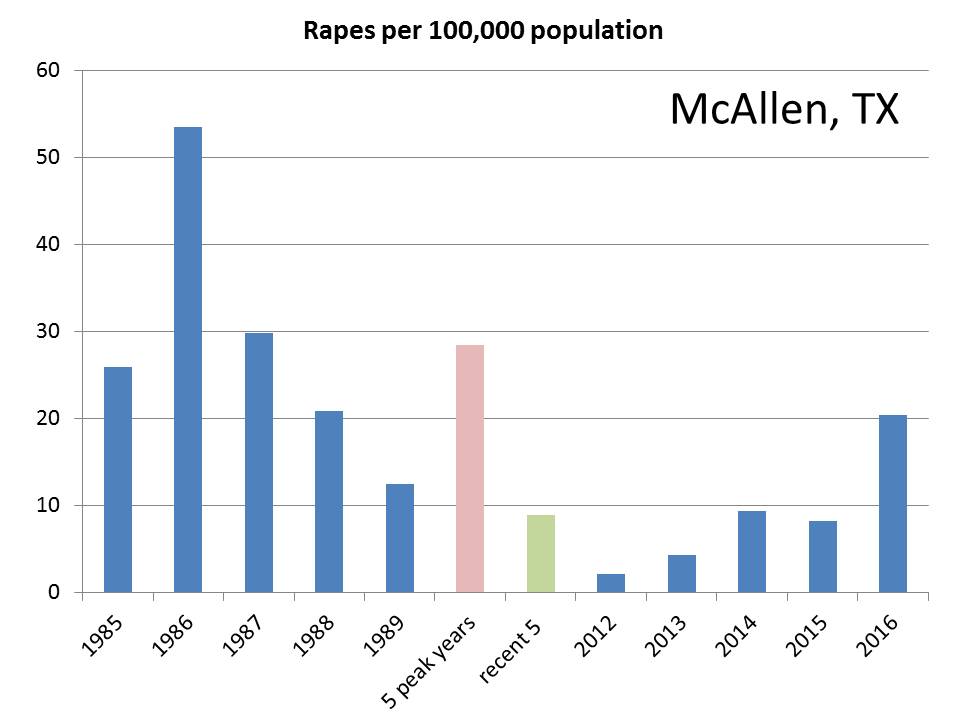
McAllen, Rate of Rape. The 2012 statistic of 2.2 per 100,000 seems an anomaly. The 2016 numbers are disturbingly high.
--------
Laredo, Violent Crime Rate.
--------
Laredo, Murder Rate.
---------
Laredo, Rate of Rape. Among the 15 sets of city statistics this one has shown marginal improvement and would even be higher if only the last two years were considered.

--------

El Paso, Violent Crime Rate.

---------
El Paso, Murder Rate.
---------
El Paso, Rate of Rape.

----------
San Diego, Rate of Violent Crimes.
---------

San Diego, Murder Rate.
----------

San Diego, Rate of Rape.

----------------
Martin Hill Ortiz is the author of Never Kill A Friend, Ransom Note Press.


Never Kill A Friend, Ransom Note Press

Never Kill A Friend is available for purchase in hard cover format and as an ebook.
The story follows Shelley Krieg, an African-American detective for the Washington DC Metro PD as she tries to undo a wrong which sent an innocent teenager to prison.

Hard cover: Amazon US
Kindle: Amazon US
Hard cover: Amazon UK
Kindle: Amazon UK
Barnes and Noble 

Martin Hill Ortiz is also the author of A Predator's Game. His epic poem, Two Mistakes, recently won second place in the Margaret Reid/Tom Howard Poetry Competition. He can be contacted at mdhillortiz@gmail.com.

Thursday, May 17, 2018

The Low Crime Rates in U.S. Cities along the Mexican Border.


In a previous post, I looked at the rates of violent crimes in border states. Those states bordering Mexico have had a huge drop in violent crime over the past 20-some years, from the time at which violent crime peaked in the United States in 1992 through 2013, the latter year being the latest data available at the time of my analysis.

The four Mexican border states and the drop in their rates of violent crimes.

California:  -63.3%
Arizona: -40.8%
New Mexico: -35.6%
Texas: -50.1%

These findings are based on the the Uniform Crime Reporting statistics. The UCR stats have been assembled by the FBI going back to the 1930s. In recent years the FBI has put their data online allowing analyses of crime rates according to standardized criteria. The annual data are, for the most part, nine months behind with the year 2016 information appearing at the end of September, 2017. In 2017, the Trump administration decided to provide much less detailed information (70% fewer tables) in comparison to previous years and this will affect future assessments.

Looking at Border Cities.

Alright, states are large and changes in crime in Northern California might not reflect activity closer to the border. So I decided to examine crime rates in another way. The FBI also collects crime statistics for cities. There are five cities on the United States-Mexico border which have a population of over 100,000.

Let's get out of the way two problems with the city statistics. First of all, as of now, the statistics available for these cities is through 2014. Secondly, in 2014, four out of five of these cities switched to the new rape definition and did not report the legacy definition numbers. This leads to an artificial bump in both rape and, to a lesser degree, total violent crime statistics for the final year of this analysis. Using national statistics over a period of four years where both definitions are used, the new definition shows a 38.1% higher incidence of rape.This figure should be reliable represents over 400,000 rapes reported with both definitions.

Violent Crime in Border Cities.

I came to this analysis with an open mind. Would I find an increase in violence? On the one hand, national violence statistics have sharply declined since the nineties. On the other hand, the city of Matamoros, on the Mexican side across the border from Brownsville, gets its name from Mata (Spanish for kill) and Moros (Moors). It did have a death cult causing havoc back in the eighties. So, is violence along the border a spooky fact or spooky myth?

The United States as a Whole.

Violent crime in the United States peaked in 1992. Percent down from peak: -51.8%.

Murders. Peaked: 1986*. Percent down from peak: -54.1%.
Rape. Peaked: 1992. Percent down from peak: -38.3%.

The United States Drop in Violent Crime.

US Decline in Violent Crime Rates
US Decline in Murder Rates
US Decline in the Rate of Rapes, Legacy Definition


A Tour of the Five Border Cities with 100,000 or more in population.


Brownsville is on the Texas-Mexican border near the Gulf of Mexico. In 2014 it had a population of 183,433.
Violent crimes. Peaked: 1988. Percent down from peak: -77.3%.
    Adjusting for legacy definition of rape: -78.5%.
Murders. Peaked: 1986. Percent down from peak: -82.9%.
Rape. Peaked: 2006. Percent down from peak: -30.0%.
    Adjusting for legacy definition: -49.3%


Brownsville Decline in Violent Crime Rate
Brownsville Decline in Murder Rate
Brownsville Decline in the Rate of Rape, Legacy Definition

Conclusion: Brownsville was a dangerous place that has greatly decreased its violence. A concerning recent uptick in rape, but still half of its peak.

McAllen.

Moseying up along the Rio Grande, 60 miles to the northwest, we come to the city of McAllen. In 2014 it had a population of 138,122.

Violent crimes. Peaked: 1994. Percent down from peak: -83.2%.
    Adjusting for legacy rape definition: -84.7%
Murders. Peaked: 1986. Percent down from peak: -56.6%.
Rape. Peaked: 2006. Percent down from peak: -75.7%.
    Adjusting for legacy definition: -82.4%.

McAllen, TX, Decline in Violent Crime Rate
McAllen, TX, Decline in Murder Rate
McAllen, TX, Decline in Rate of Rapes, Legacy Definition


Conclusion: McAllen, also, is a much safer place as is shown by its graphs.

Laredo.

Another three hours up the Rio Grande and you come to the streets of Laredo, once the capital of the Republic of the Rio Grande. In 2014, it had a population of 250,994.

Violent crimes. Peaked: 1989. Percent down from peak: -57.0%.
    Adjusting for legacy rape definition: -58.2%
Murders. Peaked: 1986. Percent down from peak: -68.2%.
Rape. Peaked: 2006. Percent down from peak: -11.9%.
    Adjusting for legacy: -36.2%.

Laredo, TX, Decline in Violent Crime Rate

Laredo, TX, Decline in Murder Rate

Laredo, TX, Decline in Rate of Rapes, Legacy Definition


The results are not quite as dramatic as they are for Brownsville and McAllen, but Laredo has also lowered its crime rate. This city had one high year (1989) in overall violent crime and if the comparisons are made to its established high in the 1990s, the decline is closer to a 40% drop. The rape statistics show a marked increase during the 1990s (prior under-reporting?).

El Paso.

The largest city along the Texas-Mexico border is El Paso. In 2014, it had a population of 680,273.

Violent crimes. Peaked: 1993. Percent down from peak: -64.4%.
    Adjusting for legacy rape definition: -65.6%
Murders. Peaked: 1986. Percent down from peak: -67.4%.
Rape. Peaked: 2006. Percent down from peak: -3.1%.
    Adjusting for legacy: -29.9%

El Paso, TX, Decline in Violent Crime Rate

El Paso, TX, Decline in Murder Rate


El Paso, TX, Decline in the Rate of Rape, Legacy Definition

El Paso has dramatically reduced its violent crime and murder rates. As with Laredo, much of the recent higher (but not highest) rate of rape is due to the revised definition.

San Diego, California has more people than the other border cities combined: in 2014, 1,368,960. They have only reported using the legacy rape definition, so there is no distinction necessary when making comparisons.

Violent crimes. Peaked: 1992. Percent down from peak: -70.3%.
Murders. Peaked: 1991. Percent down from peak: -84.4%.
Rape. Peaked: 1992. Percent down from peak: -35.6%.

San Diego, CA, Decline in Violent Crime Rate
San Diego, CA, Decline in Murder Rate
San Diego, CA, Decline in  Rate of Rapes


San Diego has shown a remarkable decrease in violent crime over the past two-plus decades.


Overall Conclusions.

Each of the border cities have shown a drop in violent crime and murder rate greater than that of the nation as a whole. While the U.S. as a whole saw a greater than 50% drop in the rate of violent crimes and murders, rapes only dropped by -38%. Each of the border cities has a lower rate of rape, with McAllen showing an -82.4% decline, and El Paso showing the least, with a-29.9% decline.

In Perspective.

In Nazi Germany, Jews were labelled as criminals and rapists. Typical is a speech of Goebbels wherein he said he does not deny Jews are humans. Neither did he deny the humanness "of murder[er]s, child rapists, thieves and pimps."

Dylan Roof, who gunned down nine African-Americans in a South Carolina church, declared the day before his attack: "you rape our women and you’re taking over our country. And you have to go."

The local head of the Ku Klux Klan clarified this sentiment: "A better target for him would have been these gang-bangers, running around rapping, raping, and stealing." [Both statements referenced here.]

Birth of a Presidency.

The same week as the comment quoted immediately above, Donald Trump, when making his speech announcing his bid for the presidency, said:

"When Mexico sends its people, they're not sending their best — they're not sending you. They’re not sending you. They're sending people that have lots of problems and they're bringing those problems with us. They're bringing drugs. They're bringing crime. They're rapists. And some, I assume, are good people."


These hateful fantasies have no basis in reality.

A Couple of Statistical Notes.

"Down from peak" is potentially a problematic statistic. It can present artifacts as findings. It works great to define what's going on when you are currently at the peak, or when the peak and trough represent consistent findings. "Down from peak" also does address whether peak violence is occurring. To account for some of its potential bias, the graphs of each year reported in the database are presented.

Legacy Rape. Rape was redefined in 2013 to include more than just forcible rape. In most cases, the legacy definition numbers are included using the older definition which allows for direct comparisons. Overall, the legacy rates compared to the newly defined rates (overall, U.S., per 100,000):

           New  Old (Legacy)
2013  35.9   25.9
2014  37.0   26.6
2015  39.3   28.4
2016  40.4   29.6

Over those four years the revised definition has a 38.1% higher rate than the legacy definition.

The U.S. had its absolute peak in murders in 1980. I chose the year 1986 to be in line with information available from the cities, from 1985 to 2014.

The UCR statistical data tool has been out of service (or just not responsive to my attempts to access it) for about a week and this prevented me from following up on some of the above questions.  Fortunately, I had already downloaded the most relevant data. I hope to write a follow-up piece, soon.

Martin Hill Ortiz is the author of Never Kill A Friend, Ransom Note Press.


Never Kill A Friend, Ransom Note Press

Never Kill A Friend is available for purchase in hard cover format and as an ebook.
The story follows Shelley Krieg, an African-American detective for the Washington DC Metro PD as she tries to undo a wrong which sent an innocent teenager to prison.

Hard cover: Amazon US
Kindle: Amazon US
Hard cover: Amazon UK
Kindle: Amazon UK
Barnes and Noble 

Martin Hill Ortiz is also the author of A Predator's Game. His epic poem, Two Mistakes, recently won second place in the Margaret Reid/Tom Howard Poetry Competition. He can be contacted at mdhillortiz@gmail.com.

Thursday, September 29, 2016

Violent Crime in 2015. A Look At The FBI Uniform Crime Report

The 2015 Uniform Crime Report was released by the FBI this past week providing an extensive portrait of crimes throughout the United States.

Since I've been analyzing where crime has been going down and where it has been going up in several recent posts, I thought I'd tackle the new information.

Previously:
The Shift in Violent Crime Rates.
Violent Crime Rates: New York City Versus New York State
Violent Crime Rates Under New York City Mayor Giuliani

First of all, I have expressed a bias against looking at single year changes. This practice can misrepresent the bigger picture. Still, if one is willing to take the data in the context that there are upward and downward blips, there is meaningful information to be found.

In my analyses I've focused on two statistics: the murder rate and the overall violent crime rate. The murder rate because murder is the most dramatic of crimes and changes in the murder rates are highly reported. The violent crime rate because it gives a much better overall sense of the extent of violence in society. Murders and non-negligible homicides made up only 1.3% of the violent crime statistics in 2015.

Between 2014 and 2015, the violent crime rate rose 2.9% across the United States and the murder rate rose 11.1%.

Let's look at how these statistics were reported. The estimable fivethirtyeight.com ran the headline:

Murders Rose At Their Fastest Pace In A Quarter-Century Last Year.
But they remain well below their peak.

And the lead paragraph:

It's official: Murder rose across the U.S. last year at the fastest pace since 1990, according to data released by the FBI on Monday. There were an estimated 15,696 murders in 2015, 1,532 more than in 2014 and the most recorded in a calendar year since 2008.

From this paragraph you might conclude that the murder rate increased during the Obama administration, 2008 being the Bush's final year. This illusion is achieved through two maneuvers: first, you would need to pay attention to the fact that the statement is being made that the 2008 (Bush) figures were higher. Second, the beginning of the paragraph speaks of murder rates, while the end speaks of total murders and does not account for the increase in population. In 2008, there were 5.4 murders per 100,000 population. In 2015, even with the rise, there were 4.9, a decrease of -9.3%. Before 2009, to find a figure below that of 4.9 you would have to go back to 1963. In a similar manner, to have a better rate for violent crimes you would need to go back to 1970. Here are the violent crime rates and murder rates with the 2015 statistics added.


Don't Let Jitters Give You The Jitters.

As I said, I'm not a big fan of year to year changes. To illustrate why, here are the figures for murder rates in Alabama (per 100,000):

2014, 5.7
2015, 7.2

Now, this represents an alarming 26.3% increase. However, if we look at these years in context, we have:

2012, 7.1
2013, 7.2
2014, 5.7
2015, 7.2

It is bad that the numbers rose from 2014, however, the bigger picture says that 2014 was unusually low.

On the opposite end is Florida. The murder rate per 100,000.

2014, 5.8
2015, 5.1

This represents a -12.1% decrease, the second best of any state. However, placing this in context we find that:

2012, 5.2
2013, 5.0
2014, 5.8
2015, 5.1

In this instance, 2014 was unnaturally high. In the case of Florida, don't panic over the 2013 to 2014 figures. Don't celebrate (too much) over the 2014 to 2015 figures.

As I've said above, while there is a focus on murders, the violence crime rates are a better judge of overall public safety and less prone to year-to-year blips. This set up some interesting contrasts. In Connecticut, the murder rate increased 37.5% in 2015 over 2014. Violent crime was down by -10%.

So, with those caveats in mind, looking at the various states (and the District of Columbia) where did the  murder rates and violent crime rates increase the most?

States with the greatest percent increase in murder rates, 2014 to 2015.
 
State (DC) %Increase_M
South Dakota 60.9
District of Columbia 51.6
Minnesota 50
Wisconsin 44.8
Alaska 42.9
Kansas 41.9
Maryland 41
Connecticut 37.5
Oklahoma 33.3
Kentucky 30.6


The ten states with the greatest percent increase in violent crime rates, 2014 to 2015. 

 
State %Increase_VC
Iowa 21.1
Vermont 18.6
South Dakota 17.9
Alaska 14.9
Wyoming 14.2
Hawaii 12.8
Missouri 12.6
Oregon 12.3
Kansas 12
West Virginia 11.8

What can be said from the listings above? Three states made it on to both lists: South Dakota, Alaska, and Kansas. Of those, South Dakota and Alaska were among states with the highest violent crime increases over the last 25 years. North Dakota (on the lists below) reversed its trend toward rather large increases in violent crimes. Beyond this, the lists are a hodge-podge of highly urbanized areas and the most rural of states.

Several of the states on the above lists were very divergent between the change in violent crime rates and the change in murder rates. Connecticut experienced the seventh largest percentage increase in murder rate and the third best drop in its violent crime rate. West Virginia had the tenth largest increase in violent crime and the fourth best drop in its murder rate.

The takeaway message is to beware of simplistic or sensational conclusions from one year's data. Within individual locations there are crime waves. Other locations often balance these out. Trends in increasing or decreasing crime take years to play out.

The five states with the greatest percent decrease in murder rates, 2014 to 2015.


State %Decrease_M
Hawaii -21.1
Florida -18.6
North Dakota -17.9
West Virginia -14.9
Idaho -14.2

The five states with the greatest percent decrease in violent crime rates, 2014 to 2015.


State %Decrease_VC
Utah -21.7
Florida -14.5
Connecticut -10
North Dakota -9.3
Massachusetts -5


Martin Hill Ortiz is the author of Never Kill A Friend, Ransom Note Press.


Never Kill A Friend, Ransom Note Press

Never Kill A Friend is available for purchase in hard cover format and as an ebook.
The story follows Shelley Krieg, an African-American detective for the Washington DC Metro PD as she tries to undo a wrong which sent an innocent teenager to prison.

Hard cover: Amazon US
Kindle: Amazon US
Hard cover: Amazon UK
Kindle: Amazon UK
Barnes and Noble 

Thursday, September 15, 2016

Violent Crime Rates Under New York City Mayor Giuliani

My previous post detailed the drop in the violent crime and murder rates in New York City since their peak twenty-five years ago and showed that it led New York State in improving crime statistics.

The differences were dramatic. In 1990, there were 2245 murders in New York City and 360 in the rest of New York State. (In 1990, New York City had approximately 40% of the state's population.) In 2014, there were 333 murders in New York City and 284 in the rest of the state. (In 2014, New York City had approximately 42% of the state population.)


Mayor Giuliani

In this post I'm going to look at the question of how much of a real decrease took place during Rudy Giuliani's tenure as mayor of New York City.

In my opinion, Rudy Giuliani is a shrill blowhard. However, it is possible that he is a shrill blowhard who was competent at something. I am going to look at statistics as to whether the drop in violent crime rate was real, substantive and represented a better performance than the United States as a whole over the same period of time. I am not going to address the methods to achieve these changes: I'm taking on a delicate enough issue as it is. While numerical changes succumb to statistics, policy matters are a forever-long debate.

Background

Rudy Giuliani, the 107th mayor of New York City, served from January 1, 1994 through December 31, 2001. This is convenient, there are no half-year or even half-month statistics to look at. Giuliani succeeded Mayor David Dinkins, in office from 1989 through 1993.

Giuliani had three police commissioners. The first was William Bratton from January 1, 1994 to April 15, 1996. The second was Howard Safir from April 15, 1996 to August 18, 2000. The third was Bernard Kalik from August 21, 2000 to December 31, 2001. (Bratton would return as police commissioner under current Mayor de Blasio.)

According to the FBI Uniform Crime Reporting, in 1993, the year before Giuliani took office, the violent crime rate in New York City was 2089.8 per 100,000 population. This was down by 12.3% from its peak in 1990. The murder rate was 26.5 per 100,000 population down by 13.6% from its peak in 1990.

In 2001, the violent crime rate in New York City was 927.5 per 100,000 population (official FBI statistics, more on this below) and the murder rate was 8.9. These represented decreases of 55.6% and 66.4%, respectively.

First question: violent crime was decreasing from 1990 to 1993, so, did that decrease accelerate? If we project the rate of decrease under the last three years of Dinkins' administration throughout the Giuliani years we would have had a 29.4% decrease in violent crimes and a 32.3% decrease in murders. The actual numbers (as mentioned above) came out to be 55.6% and 66.4%.

So far, things are looking good for Giuliani. Let's look at the thorny problem of the census figures. The FBI Uniform Crime Report Statistics are based in part on actual census figures every 10 years, in this case, 1990 and 2000. For the years in between, the numbers are based on official census projections. The problem is that the census projections for New York City in the 1990s were wrong. From 1990 to 1999, the census projection showed a total of 1.46% total growth. The actual growth over the ten years was 9.36%. This is reflected in the following figures.

Year   Population, NYC
1990  7,322,564
1993  7,347,257
1997  7,320,477 (down from 1990!)
1999  7,429,263
2000  8,008,278
2001  8,023,018

This artifact provided the violent crime rates to show an artificial dip between 1999 and 2000. While the number of violent crimes in New York City fell from 78,495 to 75,692 (-3.6%), the violent crime rate dropped by -11.0%. Similarly, while murders rose from 664 to 673, the murder rate dropped by -6.0%.

That may seem like an unfair boost to Giuliani's statistics, but the 2000 census did represent a real count. What is unfair is that throughout the 1990s, with the population being undercounted, the crime rates were artificially high, to a greater degree as the decade went on. The undercount overestimated the 1993 statistics, thereby favoring Giuliani's statistics. Indeed, the total number of murders bottomed out in 1998 at 633, while there were 714 in 2001, his final year. Without the census anomaly, the murder rate would have been increasing during those final years.

What was the actual population in 1993 (or 1999)? There is no way to be sure, but if we model a linear growth from 1990 to 2000, the 1993 population would be 2.5% higher (and subsequent crime rates, 2.4% lower) than the estimated figure. This works out to be more than it might seem. The projected changes in crime rates act like compound interest, with each year's number affecting the next.

So let's redo the 1990 to 1993 (pre-Giuliani) change and acquire the extrapolated figures that look at what would happen if the numbers continued to fall at the corrected 1990 to 1993 rate, and 1993 to 2001 (Giuliani numbers) using a linear model of population growth.

Giuliani's numbers change only slightly. Now violent crime was down -54.5% and murder -65.6%. The extrapolated changes using the 1990 to 1993 rate now bring a decrease of -33.9% in violent crimes and -36.5% in murders, if extrapolated to 2001.

Still Giuliani's stats are performing well. Furthermore, the New York City statistics outperformed those of the United States as a whole which had a drop of -32.5% in violent crime rates and -41.1% in murder rates between 1993 and 2001.

Let's look at when the changes occurred.

Violent Crimes, New York City
Year  Year-to-Year % Change
1991  -3.28
1992  -7.21
1993  -4.66
1994  -11.9
1995  -17.2
1996  -14.2
1997  -6.71
1998  -8.30
1999  -8.88
2000  -4.94
2001  -1.87

You may note that the most substantial changes took place in the years 1994 to 1996.

William Bratton served as police commissioner from January 1, 1994 to April 15, 1996, two full years and 105 days. I don't have the data to divide up partial years, but in his first two years as police commissioner, the violent crime rate dropped -27.1% and the murder rate dropped -40.6%. Counting the first full two years (1997 and 1998) of his successor, Howard Safir, the violent crime rate dropped -14.5% and the murder rate -36.7%. In the next three years of Safir and Kalik (1999 through 2001) the violent crime rate dropped another -15.0% while the murder rate rose by 10.7%. Overall, from 1997 through 2001, the violent crime rate dropped -27.3% while the murder rate dropped 30.0%. The five full years after Bratton the drop in crime rate performed equally or less well than the two full years under Bratton.
Year-to-Year Changes in the Violent Crime and Murder Rates, from 1990 to 2001. The figures from 1991 through 1999 were adjusted to account for a linear population growth from 1990 to 2000. Note the murder rate increased over the final three years.
The Cumulative Change in Violent Crime and Murder Rates. As above, adjusted for a linear population growth. The cumulative changes are calculated as 1991 through 1993 in comparison to 1990, and as 1994 through 2001 in comparison to 1993 (Dinkins' final year).

My personal verdict so far. Did Giuliani do something right? Yes: he hired Bill Bratton. Did he do something wrong? Yes: he let Bill Bratton go, forcing him out of office.

Giuliani's Final Year.

In David Dinkins final year as mayor, terrorists attacked the World Trade Center, leading to several deaths and thousands of injuries. In Giuliani's final year as mayor, terrorists attacked the World Trade Center leading to thousands of deaths and injuries.

The FBI Uniform Crime Statistics don't include the deaths and injuries from the 2001 attacks. They do include the deaths and injuries from the 1993 World Trade Center attack, the 1995 Oklahoma City attack, in fact, all other terrorist attacks on American soil.

Let's be clear: Giuliani was not behind the 9/11 attacks. Giuliani was not behind any of the 7,175 other murders that took place in New York City when he was mayor. And, of course, Dinkins was not behind the 1993 attack.

Still, the erasure of murders from the counts, just because the number is horrific, is wrong. Giuliani is not responsible for the 9/11 attacks, but is he responsible for any of the deaths or injuries of the 9/11 attacks? This is a thorny issue. A mayor does not only reduce crime through law enforcement, but, among other things, also through making sure street lamps work, and that emergency crews have timely access and coordinated communication. The last of these was a real issue when it came to firefighters hearing the evacuation orders after the first World Trade Center tower fell.

Should the communication have been better? Yes. You can argue that we know that because hindsight is 20/20, but: the buck stops at the mayor's office. Everything he did right to make New York less dangerous has to be weighed with what he didn't do.

As a result of the 9/11 attacks in New York City, 2,753 victims died and an additional 6,294 were treated for injuries at local hospitals. If these were included with Giuliani's statistics, as the World Trade Center attacks were for Dinkins, the murder rate would have reached its peak in 2001 with 43.2 murders per 100,000, an increase of 67.2% over the course of the Giuliani administration. The violent crime would be adjusted to 1040.3 per 100,000, still a healthy decrease of -49.0%.


Martin Hill Ortiz is the author of Never Kill A Friend, Ransom Note Press.


Never Kill A Friend, Ransom Note Press

Never Kill A Friend is available for purchase in hard cover format and as an ebook.
The story follows Shelley Krieg, an African-American detective for the Washington DC Metro PD as she tries to undo a wrong which sent an innocent teenager to prison.

Hard cover: Amazon US
Kindle: Amazon US
Hard cover: Amazon UK
Kindle: Amazon UK
Barnes and Noble 

Tuesday, September 13, 2016

Violent Crime Rates: New York City Versus New York State

As mentioned in my previous post, from its peak approximately 25 years ago to the most recent statistics, the rate of violent crimes in the United States has dropped by approximately 50%. The state of New York had a greater decrease (-65.2%) than any other state. I also noted that, in general, rural states have fared poorly in reducing their violent crime rate.

So, this begs the question, how much do the large cities dominate the statistics? In this particular case, how much of the reduction in violent crime was due to the decrease in crime in New York City and how much was due to the rest of the state? As noted in detail below, New York City greatly outperformed the remainder of New York State in its reduction in crime.

(This analysis is New York City, not the metropolitan area.)

Citywide and statewide crime statistics are compiled by the FBI and historical figures from 1985 to 2012 can be found at this site. Violent crime figures go through the year 2012. In that year, the definition of rape changed, increasing rape statistics by about 39%. While the FBI provides legacy definition figures for more recent years, these definitions do not extend to New York City statistics. Because of this, violent crime trends were analyzed from 1985 to 2012, while murder statistics were analyzed from 1985 to 2014.

Although New York City keeps their own statistics, I relied on the FBI resource (which provided slightly different numbers) to maintain a consistency in sources.
From its peak in 1990, New York City has had a drastic decrease in violent crime while the remainder of New York State has had a modest decrease. The rates are given for each five years. The year 1992 is included because that is when the rest of New York State peaked. The year 2012 represents the most recent year on the FBI UCR database for both entities.

In 1990, New York City had its peak in both murders and total violent crimes. The violent crime rate for that year was 2383.6 per 100,000 population and the murder rate was 30.7 per 100,000. That same year, the rest of the state of New York experienced a violent crime rate of 355.4 and a murder rate of 3.38.

In 1990, the population of New York City made up 40.7% of the population of the state but was responsible 82.2% of the violent crimes and 86.2% of the murders.
An even more dramatic drop occurred in the New York City murder rate, well beyond the improvement in the remainder of New York State.

The national violent crime rate dropped precipitously in the 1990s. By 2000, New York City saw 945.2 violent crimes per 100,000 (a drop of -60.5%) and 8.40 murders (-72.6%).  In this same time period, the rest of New York state saw 268.2 violent crimes per 100,000 (-24.5%) and 2.54 murders (-24.9%).

The more rapid drop in New York City's statistic is reflected in the fact that by 2000, New York City (with 42.2% of the state population) was then responsible for 72.0% of the violent crimes and 70.7% of the murders for the state as a whole.

From 2000 to 2012, violent crime in New York City dropped from 945.2 violent crimes per 100,000 to 639.3 (-32.4%) and murder dropped from 8.40 per 100,000 to 5.05 (-39.9%). Across the rest of New York State violent crimes dropped from 268.2 per 100,000 to 249.6, a modest decrease of -6.9% while murders dropped from 2.54 per 100,000 to 2.35 (-7.5%).

In 1990, those in New York City were 6.7 times more likely to be a victim of a violent crime than those in the rest of New York. In 2012, they were 2.7 times more likely. In 1990, those in New York City were 9.1 times more likely to be murdered. In 2012, they were 55.6% more likely.

In 1990, New York City was responsible for 86.2% of the statewide murders. In 2014, it was responsible for 54%.
Continued with Mayor Giuliani and the Decrease in Violent Crime in New York City.

Martin Hill Ortiz is the author of Never Kill A Friend, Ransom Note Press.


Never Kill A Friend, Ransom Note Press

Never Kill A Friend is available for purchase in hard cover format and as an ebook.
The story follows Shelley Krieg, an African-American detective for the Washington DC Metro PD as she tries to undo a wrong which sent an innocent teenager to prison.

Hard cover: Amazon US
Kindle: Amazon US
Hard cover: Amazon UK
Kindle: Amazon UK
Barnes and Noble 

Thursday, September 1, 2016

The Shift in Violent Crime Rates.

Two years ago I ran across a statistic stating that murders in Washington, DC had declined by 87% from their peak in 1991. Having lived in DC during the eighties in what my landlord referred to as "an aggressively urban neighborhood," I found this intriguing and decided to look into whether it was a general trend across the country. I found that, in the same time period, for the whole of the United States, murder rates dropped 52%. I tried and failed to get someone in the Public Health school interested in assembling a paper on this. Now, two years later, I decided to look in depth into what's going on.

Some of my findings were surprising. In spite of violent crime dropping by 50% across the United States, violent crime has been going up in the border states—the Canadian border states. It has fallen significantly in the four states bordering Mexico. I decided to test a few theories as to what is going on.

A Word About Sources.

The FBI maintains a database called Uniform Crime Reporting which looks at the numbers and population frequencies of violent and property crime. I downloaded the crime statistics by state (and the District of Columbia) going back to 1960 and started digging. [Excel files are available by request.]

First of all, I focused on crime rates (per 100,000), rather than total crimes. California should not be considered the most crime-ridden state because it has six times as many people as the "average" state. On the other extreme, Detroit should not be considered to have a drop in crime rate because of losing population.

Note: the FBI database has some quirks and limitations. The previous year's statistics are not released until late September, so the final year figuring into my calculations is 2014. The 9/11 attacks were excluded from the violent crimes statistics for 2001 which would certainly have made New York City's statistics look bad that year. This exclusion was not extended to other terrorist attacks (e.g., Oklahoma City, Fort Hood). In 2012, the definition of rape was changed which has lead to more crimes being considered rape (38.6% more rapes in 2014 using the new classification versus old). The FBI, however, also reports the number of rapes by the "legacy definition," which I used in my calculations to compare rape figures and to adjust the total violent crime figures of the last two years.

Information on the population make-up of states came from the US Census Bureau. Some were available through their "Quick Facts" section, others as part of the 2010 Census Report.

Violent Crimes, the United States as a Whole.


Violent crimes are defined by the FBI as murder and non-negligent manslaughter, rape, robbery and aggravated assault. Robbery involves the victim being present whereas burglary is when the victim is absent, the latter being a property crime. Aggravated assault and robbery dominate the statistics.


Category           Percent Total
Aggravated Assault    63.6%
Robbery               28.0%
Rape (legacy definition)      7.2%
Murder, non-negligent manslaughter     1.2%
Source.

Due to the fact that murder is such a small portion of the overall violent crimes, I decided to mostly focus on the bigger picture, violent crimes.

Violent crime rates rose drastically from 1960 to 1980 (270.8%), rose somewhat from 1980 to 1991 (27.1%), and then began a drastic decline since (down 51.8%).
Violent Crime Rate per 100,000, U.S., 1960 to 2014, from FBI, Uniform Crime Reporting Statistics.
Murder and Non-negligible Manslaughter Rate per 100,000, U.S., 1960 to 2014. Ibid.

Individual years have blips. These can be particularly significant when it comes to sparsely populated states and those with low crime rates. For example, in 1994, North Dakota had one murder, (further evidence that the Coen brothers misnamed their 1996 film) while averaging six a year for the decade. To smooth out these blips, I averaged three consecutive years together with the reported year being the central one.

The year 1992 was chosen as the reference year because this set of three years (1991, 1992, 1993) is when the violent crime levels peaked nationwide with 758.2, 757.7, and 747.1 incidents per 100,000 population, respectively, averaging out to 754.3 for these three years. The three most recent years, 2012, 2013, 2014 saw violent crimes at a rate of 386.9, 369.0 and 365.6, respectively for an average of 373.8, for a drop of 50.4%. (I will refer to these two time points as [1992] and [2013].)

Following this trend, murder rates for all of the United States have declined from 9.5 per 100,000 in [1992] to 4.6 per 100,000 in [2013], a drop of 51.6%.

The States where Violent Crime has Gone Down the Most (and Least).

Below is a map showing the change in violent crime statistics by state from 1991 to 2013. With 50 states plus the District of Columbia, the total of 51 was divisible by three and I highlighted the 17 best performing states (with the greatest reduction in crime) in lime green, the 17 worst performing in red, and the middle group in pink.

Changes in the Rates of Violent Crimes, [1992] to [2013]. The more negative a number, the greater improvement.

These are the ten states with the most improvement.

Most Improved  Percent change
 1 New York     -65.2%
 2 California        -63.3%
 3 Illinois     -61.7%
 4 Florida     -59.0%
 5 Kentucky    -57.1%
 6 New Jersey     -55.9%
 7 Michigan    -54.5%
 8 Oregon      -53.9%
 9 Maryland    -53.2%
10 Texas                  -50.1%

These are the ten states with increased violent crime rates or else the least improvement.

Worse Rates or Least Improvement
 1 North Dakota       230.3%
 2 Montana           73.8%
 3 South Dakota         63.8%
 4 New Hampshire  50.9%
 5 West Virginia         36.5%
 6 Vermont          5.6%
 7 Wisconsin           2.0%
 8 Hawaii           -3.7%
 9 Maine              -6.4%
10 Alaska       -11.0%

Because the previous map was so busy, I decided to show one which only highlights the states with the top ten best and worst performances.


Border States.

The first thing that jumped out at me were the border states. There are four states which border Mexico: California, Arizona, New Mexico and Texas. Two of these, California and Texas, are among the top ten for the greatest improvement in violent crime statistics. Arizona and New Mexico have also seen healthy improvements of -40.8% and -35.6%, respectively.

There are ten states sharing land borders with Canada (eleven including Michigan, connected by bridges). Of these, six are among the bottom ten regarding improvement in violent crime rates.

So, what's going on here?

Hypothesis one
. There is something about being contiguous with Canada that raises crime rates. For example, perhaps border smuggling (narcotics, other criminal activities) is a real problem. I looked for support of this hypothesis but I came across only general reports and sensational articles rather than a comprehensive analysis.

In favor of this hypothesis.

As mentioned above, six out of ten is a surprisingly large number to achieve by chance.

Arguing against this hypothesis.

  • New York, a border state, had the highest drop in violent crimes. Minnesota, Michigan and Washington also had sizeable drops while Idaho had a modest drop. Michigan might be a separate case. It could be that with bridge crossings, Michigan has a well-regulated border. 
  • New Hampshire and Idaho have smallish borders.
  • This hypothesis doesn't explain West Virginia, South Dakota, Wisconsin or Hawaii. (But then does one hypothesis need to explain everything?)
  • The problems attendant with North Dakota's oil boom have been well-documented and are rather unique. The rise in violent crimes, however, preceded the population boom of the mid-2000s.

Alternative hypothesis. Most of these states have something else in common besides bordering Canada.

My original observation was that the District of Columbia had a precipitous fall in murders. Compared to the 50 states, Washington, DC is the most urban (100%). In contrast, Maine, New Hampshire, Vermont, Montana and West Virginia are all among the most rural of states. My first alternative hypothesis is that violent crime rates are up in primarily rural states and down in urban states.

So, what is rural and what is urban? The United States Census Bureau pondered this question and came up with two definitions of urban and one for rural that they have used since 1990. From their website:

  • Urbanized Areas of 50,000 or more people;
  • Urban Clusters of at least 2,500 and less than 50,000 people.
  • "Rural" encompasses all population, housing, and territory not included within an urban area or cluster.

While living in cities of below 2,500 people (or not in cities at all) seemed to define rural, I decided that urban should counted as people in the urbanized areas of 50,000 or more.

So I tested this hypothesis by comparing the most poorly performing states using two standards:

Which states have the highest percentage in rural populations.
Which states have the lowest percentage in urbanized areas.

These numbers can be derived from individual state profiles from the Census Bureau (Table 2 in the linked example). Often rural and non-urban correspond to one another. In other cases, such as Alaska, Alaska is very much a non-urban state, but is the 33rd most rural.

Here is the ranking of the fifteen worse performers in the violent crime statistics, according to the ranking as being rural or least urban.


State     V. Crimes     Most Rural     Least Urban
North Dakota  1 10 13
Montana    2 5 4
South Dakota 3 7 6
New Hampshire  4 11 17
West Virginia 5 3 7
Vermont 6 2 1
Wisconsin 7 18 23
Hawaii  8 46 35
Maine 9 1 3
Alaska 10 33 10
Iowa 11 12 11
Tennessee 12 17 20
Nevada 13 48 42
Arkansas 14 6 8
Pennsylvania 15 31 34


Six out of the top ten of the worst performers were also among the ten most rural states, along with six out of ten of the least urban. West Virginia and South Dakota now fit into the explanation. Among the top ten, not fitting into either explanation are Hawaii and Wisconsin.

There has been a lot of news about rises in rural crime. I am reluctant to link to these reports, inasmuch as it seems to me to be a sort of confirmation bias.

The Decline of White Privilege.

A lot has also been written about the decline in white privilege, that is, as America has become more diverse, the relative power of being white in America has declined. I am not going to comment on the validity of the arguments, but it is hard to escape that several of the poorer performing states are among those that are least racially diverse. Among some people, the word "urban" connotes a mix of minorities. Here the most poorly performing states are compared to their ranking as being least diverse.


State     White, non-Hispanic
North Dakota  7
Montana    6
South Dakota 10
New Hampshire  4
West Virginia 3
Vermont 2
Wisconsin 12
Hawaii  51
Maine 1
Alaska 32
Iowa 5
Tennessee 37
Nevada 46
Arkansas 25
Pennsylvania 19


Now we have seven of the least racially diverse states making up the top ten, along with Iowa (number 11 poorest performer, 5th least diverse) also falling into the group, and Wisconsin nearby (7th poorest performer, 12th least racially diverse). Hawaii, the most racially diverse state, is anomalous.

So, What's the Verdict?

Frankly, rural, non-urban, near Canada and mostly white overlap with one another. It is hard to tease one from the other. Still I would submit that something worth looking into is going on here. Violent crimes, whether rural or urban, have victims. It is possible we are ignoring the dramatic increases in crime rates in Montana, South Dakota, New Hampshire, North Dakota, and West Virginia because they are lost when we look at overall crime rates.

Changes in individual states are probably strongly driven by economic forces, economic success in North Dakota and the collapse of the coal economy in West Virginia. Perhaps a change in rural economy in general is at the heart of the problem. It should be noted that notorious "rust-bucket" states and many of those that have lost considerable manufacturing jobs, did well in terms of decreasing crime.

It is possible that there is a perception of crime increasing everywhere among those who are witnessing local increases. Therefore rural states may be more susceptible to concerns about crime even though overall crime statistics have drastically decreased.


A Great Divide.

The United States has become more polarized. Some in the media play up the fear of city and this is embraced, often with an undertone of racism and superiority: big cities have crime, cronyism, and are corrupt with Boss Tweed-type politicians. In defense of their arguments they will cite the higher total crime rates although it is likely that the urban warfare seen in fictional crime shows is mixed into the view. Psychotic taxi drivers stalk the streets. Living in New York City would be horrible.

Another segment of the media depict rural America as backwards, often through the lens of a different brand of superiority. They see rural America as uncultured, intolerant and teeming with corrupt Huey Long-type politicians. They will cite how these states come in near last in markers of health, education, and income. Klansmen stalk the streets. Living in Alabama would be horrible.

Neither of these are true pictures. I've lived in the inner city and in small towns. Life goes on. Most folks are decent. There is still a large chance you will not meet with a violent crime in either place.

Interestingly, you are more likely to die from violence in rural areas. Violent accidents, particularly vehicle accidents, dominate death-by-violence statistics.

Additional Notes.

Violent crime rates versus changes in violent crime rates. To be clear, urban centers have higher violent crime rates than rural areas. Concentrating people together has this effect. However, both crime rates and changes in crime rates have stories to tell, and while the total crime in urban centers is well-discussed, I have focused on changes in violent crime rates because they tell an important additional story.

In [1992] North Dakota was 14 times safer than New York. In [2012] it was 34.9% safer.

The FBI provides stern warnings about the misuse of the Uniform Crime Reporting statistics. These warnings ask you not to take crime out of context (urbanization, poverty, etc.). These types of warnings are particularly directed to their statistics on crime in universities. In this analysis, I have tried to find context.

Don't Chase Blips.

Other than in the cases where violent crime rates steadily improve or worsen year-to-year, every year, you will have upturns and downturns. These get magnified in the press, sometimes even microblips such as single month reports in single cities are drawn out as meaningful. This is usually done with fear-mongering. Sometimes crime in one locality will go up dramatically, while in another it goes down. It either balances out and should be taken in this context, or else it will continue and become a trend. In the latter case, waiting for a multi-year change is necessary.

In line with this, I've endeavored to avoid the overtly political commentary that can come with this subject. I raised my eyebrows as to why two mostly liberal border states, Minnesota and New York have had drops in crime rates while more conservative border states did not. I didn't want to go there. What is conservative? What is liberal? Texas has certainly had more than two decades of conservative governors and has had a drastic drop in violent crime. California is a mixed bag of governance and had an even greater drop. There may be an overtly political story somewhere in these data, I didn't seek it out. It will probably not be a simplistic one.

A note for those who believe in conspiracies and doctored crime rate statistics. Yes, doctoring can occur. Some states change definitions. The FBI changes definitions over time. But to describe overall changes in this form is paranoia. There is no grand conspiracy that explains the decreases in crime rates in California, New York, Texas, Florida, etc. over a period of decades.

Continued in New York City Versus New York State.

Martin Hill Ortiz is the author of Never Kill A Friend, Ransom Note Press.


Never Kill A Friend, Ransom Note Press

Never Kill A Friend is available for purchase in hard cover format and as an ebook.
The story follows Shelley Krieg, an African-American detective for the Washington DC Metro PD as she tries to undo a wrong which sent an innocent teenager to prison.

Hard cover: Amazon US
Kindle: Amazon US
Hard cover: Amazon UK
Kindle: Amazon UK
Barnes and Noble