Showing posts with label Murder Rate. Show all posts

Wednesday, May 30, 2018

The Low Degree of Violence in U.S. - Mexican Border Cities

U.S.-Mexican border cities have been experiencing a historically low rate of violent crimes, at least through 2016, the most recent year with statistics available from the FBI's Uniform Crime Reports.

In my previous analyses, I looked at the recent rate of violent crimes versus the peak year. In that study I used statistics through 2014 which were the most recent numbers compiled into the city tables. Since then I discovered that the 2015 and 2016 annual reports included information for major cities.

So: this post includes the years 2015 and 2016 and rather than look at single year peaks, I compared the peak five consecutive years to the most recent five consecutive years. Being a different analysis, and less reliant on single year peaks, the numbers come out a bit differently, and are less prone to error.

To be clear: these data, the most recent available, represent crime through the end of the Obama administration and this is not a commentary on subsequent changes.

The five cities chosen were those U.S. cities that had over 100,000 in population and which border Mexico: Brownsville, McAllen, Laredo, El Paso, all in Texas, and San Diego, in California. The statistics used were total violent crime rates, murder rates and the rate of rapes, available in the FBI city tables beginning with the year 1985.

Of the cities/measurements, all 15 show lower crime rates in recent years: in most cases, dramatically lower.

Brownsville Violent Crimes. Down by 76.5%
" " Murders. Down by 88.3%
" " Rape. Down by 49.1%

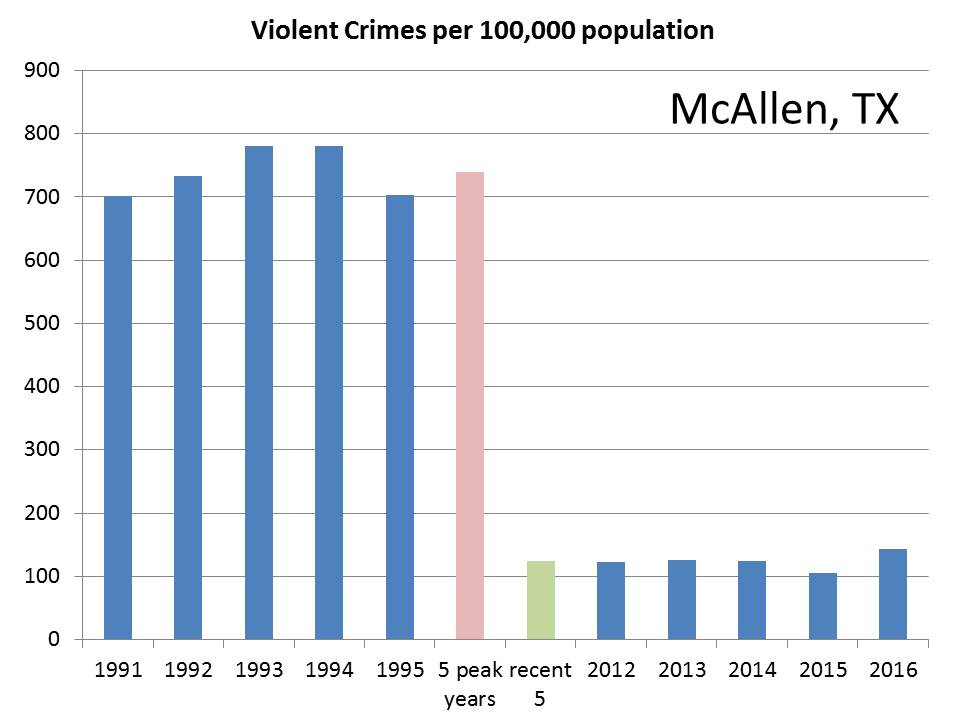
McAllen Violent Crimes. Down by 83.2%
" " Murders. Down by 67.6%
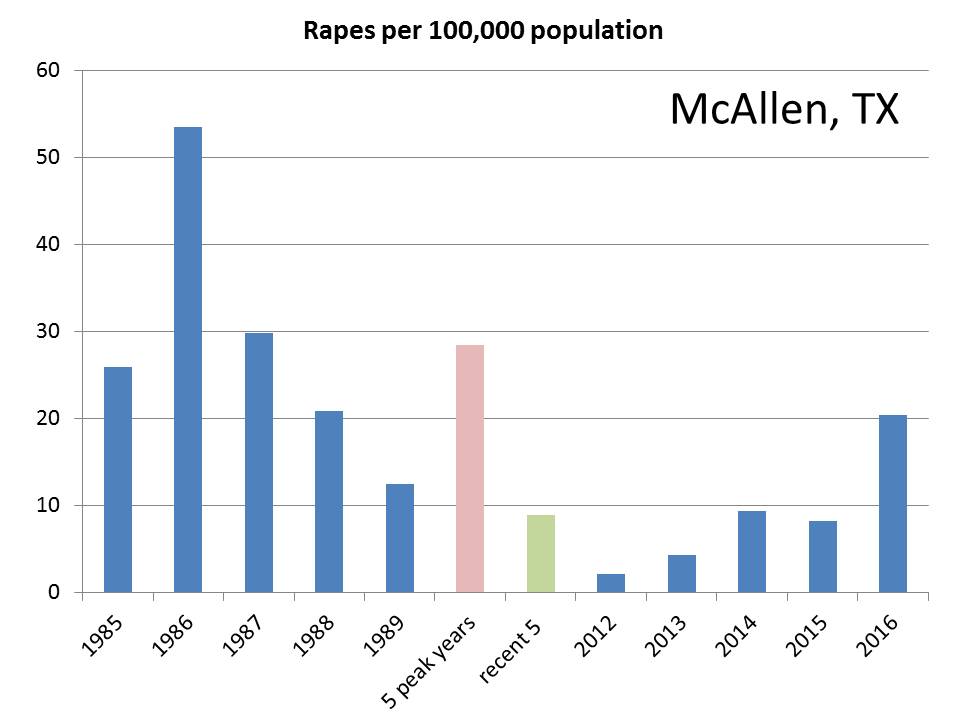
" " Rape. Down by 68.8%
 
Laredo Violent Crimes. Down by 37.7%
" " Murders. Down by 75.7%
" " Rape. Down by 6.1%

While all other city statistics show a 30% drop or more, rapes in Laredo had a negligible drop.

El Paso Violent Crimes. Down by 64.0%
" " Murders. Down by 68.1%
" " Rape. Down by 33.7%


San Diego Violent Crimes. Down by 66.7%
" " Murders. Down by 76.9%
" " Rape. Down by 32.8%

United States. Violent Crimes. Down by 49.3%
" " Murders. Down by 48.6%
" " Rape. Down by 33.7%

Four out of five of the border cities had violent crimes drop at a greater rate than the U.S. as a whole. Five out of five had murder drop at a greater (much greater) rate than the U.S. as a whole. Three out of five of the cities did equal or better in improving their rape statistics. (El Paso tied, San Diego less than one percent behind, and Laredo not doing well.) In total, according to the metrics, the border cities outperformed the U.S. as a whole in 11 out of 15 measures, with one tie.

So, here are the graphs.

Brownsville.


Brownsville, Violent Crimes per 100,000 population. The pink bar represents the average crime rate in the city's peak years of violent crime, which are shown individually in the leftmost bars. The green bar is the average for the five most recent years. FBI UCR statistics are compiled back to 1985.
------------
Brownsville Murder Rates. The legend corresponds to the one described above.
----------
Brownsville, Rate of Rape.
----------

McAllen, Violent Crime Rate.
---------
McAllen, Murder Rate.
--------

McAllen, Rate of Rape. The 2012 statistic of 2.2 per 100,000 seems an anomaly. The 2016 numbers are disturbingly high.
--------
Laredo, Violent Crime Rate.
--------
Laredo, Murder Rate.
---------
Laredo, Rate of Rape. Among the 15 sets of city statistics this one has shown marginal improvement and would even be higher if only the last two years were considered.

--------

El Paso, Violent Crime Rate.

---------
El Paso, Murder Rate.
---------
El Paso, Rate of Rape.

----------
San Diego, Rate of Violent Crimes.
---------

San Diego, Murder Rate.
----------

San Diego, Rate of Rape.

----------------
Martin Hill Ortiz is the author of Never Kill A Friend, Ransom Note Press.


Never Kill A Friend, Ransom Note Press

Never Kill A Friend is available for purchase in hard cover format and as an ebook.
The story follows Shelley Krieg, an African-American detective for the Washington DC Metro PD as she tries to undo a wrong which sent an innocent teenager to prison.

Hard cover: Amazon US
Kindle: Amazon US
Hard cover: Amazon UK
Kindle: Amazon UK
Barnes and Noble 

Martin Hill Ortiz is also the author of A Predator's Game. His epic poem, Two Mistakes, recently won second place in the Margaret Reid/Tom Howard Poetry Competition. He can be contacted at mdhillortiz@gmail.com.

Friday, September 30, 2016

Crime Statistic Changes By Presidential Administration

Mark Twain attributed one of his more famous quotes to British Prime Minister Benjamin Disraeli. "There are three kinds of lies: lies, damned lies, and statistics."

I would counter: liars lie. They lie with words or they lie with statistics. Words and statistics can be loaded weapons, but they are, of themselves, innocent.

Over several posts, I've been trying to elucidate what is happening with the violent crime rates in the United States over the last several decades. Along the way, I've pointed out that in the last 25 years, urban crime has gone down dramatically, while crime in rural states is on the increase. Previously:

The Shift in Violent Crime Rates.
Violent Crime Rates: New York City Versus New York State
Violent Crime Rates Under New York City Mayor Giuliani
The Violent Crime Rate in 2015

Now, I'd like to present the violent crime rate changes by presidential administration. Let me make it clear up front, I am not suggesting that presidents are so powerful they can change many of the factors which go in to crime. For example, the increase in crime during the sixties, seventies and eighties came primarily with the baby boom. Crime increases as the population skews younger, and the reverse trend benefits presidents presiding over the swell of baby boomers as they grew older.

Of course there are factors which the president does influence either by initiatives that attack crime directly or indirectly. An example of the latter case is stabilizing the economy and reducing unemployment. Regardless of these caveats, I'm a great believer in the philosophy that "The Buck Stops Here."

All of this said, the take home message is that while these statistics do not tell a simple tale of one party's success over another, I hope they dispel some myths, such as "violent crime dropped (or rose) dramatically during so-and-so's administration," when it didn't.


These numbers were calculated from the FBI's Uniform Crime Reporting statistics, 1960 to 2015. The last full year of the previous administration was compared to the final full year of the reported administration. 1963 was considered Kennedy's last full year (shortened by 40 days) and 1973 was considered Nixon's last full year rather than 1974.

In the following tables, "best" refers to the greatest degree in which crime rate was reduced, while the worst performer had the greatest increase. Only the top three presidents had decreases in the violent crime rates during their administrations while six presidents had decreases in the murder rates. Murder rates jump around.

The Last Ten Presidents Ranked by Best Cumulative Performance, Violent Crime Rate.

  1.  William Clinton
  2.  Barack Obama
  3.  George W. Bush, Jr.
  4.  John F. Kennedy
  5.  Ronald Reagan
  6.  Gerald Ford
  7.  George H.W. Bush, Sr.
  8.  James Carter
  9.  Richard Nixon
  10.  Lyndon B Johnson

The Last Ten Presidents Ranked by Best Cumulative Performance, Murder Rate.
  1.  William Clinton
  2.  Ronald Reagan
  3.  John F. Kennedy
  4.  Barack Obama
  5.  Gerald Ford
  6.  George W. Bush, Jr.
  7.  George H.W. Bush, Sr.
  8.  James Carter
  9.  Richard Nixon
  10.  Lyndon B. Johnson
To some extent, it's not fair to compare cumulative changes. Why should Ford's -7.4% reduction in the murder rate in two years not be better than Reagan's -16.7% reduction in eight years? On the other hand, there is no guarantee that Ford would have continued with that initial rate if he did serve two full terms. So, taking these numbers with a grain of salt, here are rankings of the presidents adjusted for length of time in office.

The Last Ten Presidents Ranked by Change in Violent Crime Rate, Adjusting for Number of Years. 

  1.  William Clinton
  2.  Barack Obama
  3.  George W. Bush, Jr.
  4.  Ronald Reagan
  5.  John F. Kennedy
  6.  George H.W. Bush, Sr.
  7.  Gerald Ford
  8.  James Carter
  9.  Richard Nixon
  10.  Lyndon B. Johnson

The Last Ten Presidents Ranked by Change in Murder Rate, Adjusting for Number of Years.

  1.  William Clinton
  2.  Gerald Ford
  3.  John F. Kennedy
  4.  Ronald Reagan
  5.  Barack Obama
  6.  George W. Bush, Jr.
  7.  George H.W. Bush, Sr.
  8.  James Carter
  9.  Richard Nixon
  10.  Lyndon B. Johnson
-----------------------

Martin Hill Ortiz is the author of Never Kill A Friend, Ransom Note Press.


Never Kill A Friend, Ransom Note Press

Never Kill A Friend is available for purchase in hard cover format and as an ebook.
The story follows Shelley Krieg, an African-American detective for the Washington DC Metro PD as she tries to undo a wrong which sent an innocent teenager to prison.

Hard cover: Amazon US
Kindle: Amazon US
Hard cover: Amazon UK
Kindle: Amazon UK
Barnes and Noble 


Thursday, September 29, 2016

Violent Crime in 2015. A Look At The FBI Uniform Crime Report

The 2015 Uniform Crime Report was released by the FBI this past week providing an extensive portrait of crimes throughout the United States.

Since I've been analyzing where crime has been going down and where it has been going up in several recent posts, I thought I'd tackle the new information.

Previously:
The Shift in Violent Crime Rates.
Violent Crime Rates: New York City Versus New York State
Violent Crime Rates Under New York City Mayor Giuliani

First of all, I have expressed a bias against looking at single year changes. This practice can misrepresent the bigger picture. Still, if one is willing to take the data in the context that there are upward and downward blips, there is meaningful information to be found.

In my analyses I've focused on two statistics: the murder rate and the overall violent crime rate. The murder rate because murder is the most dramatic of crimes and changes in the murder rates are highly reported. The violent crime rate because it gives a much better overall sense of the extent of violence in society. Murders and non-negligible homicides made up only 1.3% of the violent crime statistics in 2015.

Between 2014 and 2015, the violent crime rate rose 2.9% across the United States and the murder rate rose 11.1%.

Let's look at how these statistics were reported. The estimable fivethirtyeight.com ran the headline:

Murders Rose At Their Fastest Pace In A Quarter-Century Last Year.
But they remain well below their peak.

And the lead paragraph:

It's official: Murder rose across the U.S. last year at the fastest pace since 1990, according to data released by the FBI on Monday. There were an estimated 15,696 murders in 2015, 1,532 more than in 2014 and the most recorded in a calendar year since 2008.

From this paragraph you might conclude that the murder rate increased during the Obama administration, 2008 being the Bush's final year. This illusion is achieved through two maneuvers: first, you would need to pay attention to the fact that the statement is being made that the 2008 (Bush) figures were higher. Second, the beginning of the paragraph speaks of murder rates, while the end speaks of total murders and does not account for the increase in population. In 2008, there were 5.4 murders per 100,000 population. In 2015, even with the rise, there were 4.9, a decrease of -9.3%. Before 2009, to find a figure below that of 4.9 you would have to go back to 1963. In a similar manner, to have a better rate for violent crimes you would need to go back to 1970. Here are the violent crime rates and murder rates with the 2015 statistics added.


Don't Let Jitters Give You The Jitters.

As I said, I'm not a big fan of year to year changes. To illustrate why, here are the figures for murder rates in Alabama (per 100,000):

2014, 5.7
2015, 7.2

Now, this represents an alarming 26.3% increase. However, if we look at these years in context, we have:

2012, 7.1
2013, 7.2
2014, 5.7
2015, 7.2

It is bad that the numbers rose from 2014, however, the bigger picture says that 2014 was unusually low.

On the opposite end is Florida. The murder rate per 100,000.

2014, 5.8
2015, 5.1

This represents a -12.1% decrease, the second best of any state. However, placing this in context we find that:

2012, 5.2
2013, 5.0
2014, 5.8
2015, 5.1

In this instance, 2014 was unnaturally high. In the case of Florida, don't panic over the 2013 to 2014 figures. Don't celebrate (too much) over the 2014 to 2015 figures.

As I've said above, while there is a focus on murders, the violence crime rates are a better judge of overall public safety and less prone to year-to-year blips. This set up some interesting contrasts. In Connecticut, the murder rate increased 37.5% in 2015 over 2014. Violent crime was down by -10%.

So, with those caveats in mind, looking at the various states (and the District of Columbia) where did the  murder rates and violent crime rates increase the most?

States with the greatest percent increase in murder rates, 2014 to 2015.
 
State (DC) %Increase_M
South Dakota 60.9
District of Columbia 51.6
Minnesota 50
Wisconsin 44.8
Alaska 42.9
Kansas 41.9
Maryland 41
Connecticut 37.5
Oklahoma 33.3
Kentucky 30.6


The ten states with the greatest percent increase in violent crime rates, 2014 to 2015. 

 
State %Increase_VC
Iowa 21.1
Vermont 18.6
South Dakota 17.9
Alaska 14.9
Wyoming 14.2
Hawaii 12.8
Missouri 12.6
Oregon 12.3
Kansas 12
West Virginia 11.8

What can be said from the listings above? Three states made it on to both lists: South Dakota, Alaska, and Kansas. Of those, South Dakota and Alaska were among states with the highest violent crime increases over the last 25 years. North Dakota (on the lists below) reversed its trend toward rather large increases in violent crimes. Beyond this, the lists are a hodge-podge of highly urbanized areas and the most rural of states.

Several of the states on the above lists were very divergent between the change in violent crime rates and the change in murder rates. Connecticut experienced the seventh largest percentage increase in murder rate and the third best drop in its violent crime rate. West Virginia had the tenth largest increase in violent crime and the fourth best drop in its murder rate.

The takeaway message is to beware of simplistic or sensational conclusions from one year's data. Within individual locations there are crime waves. Other locations often balance these out. Trends in increasing or decreasing crime take years to play out.

The five states with the greatest percent decrease in murder rates, 2014 to 2015.


State %Decrease_M
Hawaii -21.1
Florida -18.6
North Dakota -17.9
West Virginia -14.9
Idaho -14.2

The five states with the greatest percent decrease in violent crime rates, 2014 to 2015.


State %Decrease_VC
Utah -21.7
Florida -14.5
Connecticut -10
North Dakota -9.3
Massachusetts -5


Martin Hill Ortiz is the author of Never Kill A Friend, Ransom Note Press.


Never Kill A Friend, Ransom Note Press

Never Kill A Friend is available for purchase in hard cover format and as an ebook.
The story follows Shelley Krieg, an African-American detective for the Washington DC Metro PD as she tries to undo a wrong which sent an innocent teenager to prison.

Hard cover: Amazon US
Kindle: Amazon US
Hard cover: Amazon UK
Kindle: Amazon UK
Barnes and Noble 

Thursday, September 15, 2016

Violent Crime Rates Under New York City Mayor Giuliani

My previous post detailed the drop in the violent crime and murder rates in New York City since their peak twenty-five years ago and showed that it led New York State in improving crime statistics.

The differences were dramatic. In 1990, there were 2245 murders in New York City and 360 in the rest of New York State. (In 1990, New York City had approximately 40% of the state's population.) In 2014, there were 333 murders in New York City and 284 in the rest of the state. (In 2014, New York City had approximately 42% of the state population.)


Mayor Giuliani

In this post I'm going to look at the question of how much of a real decrease took place during Rudy Giuliani's tenure as mayor of New York City.

In my opinion, Rudy Giuliani is a shrill blowhard. However, it is possible that he is a shrill blowhard who was competent at something. I am going to look at statistics as to whether the drop in violent crime rate was real, substantive and represented a better performance than the United States as a whole over the same period of time. I am not going to address the methods to achieve these changes: I'm taking on a delicate enough issue as it is. While numerical changes succumb to statistics, policy matters are a forever-long debate.

Background

Rudy Giuliani, the 107th mayor of New York City, served from January 1, 1994 through December 31, 2001. This is convenient, there are no half-year or even half-month statistics to look at. Giuliani succeeded Mayor David Dinkins, in office from 1989 through 1993.

Giuliani had three police commissioners. The first was William Bratton from January 1, 1994 to April 15, 1996. The second was Howard Safir from April 15, 1996 to August 18, 2000. The third was Bernard Kalik from August 21, 2000 to December 31, 2001. (Bratton would return as police commissioner under current Mayor de Blasio.)

According to the FBI Uniform Crime Reporting, in 1993, the year before Giuliani took office, the violent crime rate in New York City was 2089.8 per 100,000 population. This was down by 12.3% from its peak in 1990. The murder rate was 26.5 per 100,000 population down by 13.6% from its peak in 1990.

In 2001, the violent crime rate in New York City was 927.5 per 100,000 population (official FBI statistics, more on this below) and the murder rate was 8.9. These represented decreases of 55.6% and 66.4%, respectively.

First question: violent crime was decreasing from 1990 to 1993, so, did that decrease accelerate? If we project the rate of decrease under the last three years of Dinkins' administration throughout the Giuliani years we would have had a 29.4% decrease in violent crimes and a 32.3% decrease in murders. The actual numbers (as mentioned above) came out to be 55.6% and 66.4%.

So far, things are looking good for Giuliani. Let's look at the thorny problem of the census figures. The FBI Uniform Crime Report Statistics are based in part on actual census figures every 10 years, in this case, 1990 and 2000. For the years in between, the numbers are based on official census projections. The problem is that the census projections for New York City in the 1990s were wrong. From 1990 to 1999, the census projection showed a total of 1.46% total growth. The actual growth over the ten years was 9.36%. This is reflected in the following figures.

Year   Population, NYC
1990  7,322,564
1993  7,347,257
1997  7,320,477 (down from 1990!)
1999  7,429,263
2000  8,008,278
2001  8,023,018

This artifact provided the violent crime rates to show an artificial dip between 1999 and 2000. While the number of violent crimes in New York City fell from 78,495 to 75,692 (-3.6%), the violent crime rate dropped by -11.0%. Similarly, while murders rose from 664 to 673, the murder rate dropped by -6.0%.

That may seem like an unfair boost to Giuliani's statistics, but the 2000 census did represent a real count. What is unfair is that throughout the 1990s, with the population being undercounted, the crime rates were artificially high, to a greater degree as the decade went on. The undercount overestimated the 1993 statistics, thereby favoring Giuliani's statistics. Indeed, the total number of murders bottomed out in 1998 at 633, while there were 714 in 2001, his final year. Without the census anomaly, the murder rate would have been increasing during those final years.

What was the actual population in 1993 (or 1999)? There is no way to be sure, but if we model a linear growth from 1990 to 2000, the 1993 population would be 2.5% higher (and subsequent crime rates, 2.4% lower) than the estimated figure. This works out to be more than it might seem. The projected changes in crime rates act like compound interest, with each year's number affecting the next.

So let's redo the 1990 to 1993 (pre-Giuliani) change and acquire the extrapolated figures that look at what would happen if the numbers continued to fall at the corrected 1990 to 1993 rate, and 1993 to 2001 (Giuliani numbers) using a linear model of population growth.

Giuliani's numbers change only slightly. Now violent crime was down -54.5% and murder -65.6%. The extrapolated changes using the 1990 to 1993 rate now bring a decrease of -33.9% in violent crimes and -36.5% in murders, if extrapolated to 2001.

Still Giuliani's stats are performing well. Furthermore, the New York City statistics outperformed those of the United States as a whole which had a drop of -32.5% in violent crime rates and -41.1% in murder rates between 1993 and 2001.

Let's look at when the changes occurred.

Violent Crimes, New York City
Year  Year-to-Year % Change
1991  -3.28
1992  -7.21
1993  -4.66
1994  -11.9
1995  -17.2
1996  -14.2
1997  -6.71
1998  -8.30
1999  -8.88
2000  -4.94
2001  -1.87

You may note that the most substantial changes took place in the years 1994 to 1996.

William Bratton served as police commissioner from January 1, 1994 to April 15, 1996, two full years and 105 days. I don't have the data to divide up partial years, but in his first two years as police commissioner, the violent crime rate dropped -27.1% and the murder rate dropped -40.6%. Counting the first full two years (1997 and 1998) of his successor, Howard Safir, the violent crime rate dropped -14.5% and the murder rate -36.7%. In the next three years of Safir and Kalik (1999 through 2001) the violent crime rate dropped another -15.0% while the murder rate rose by 10.7%. Overall, from 1997 through 2001, the violent crime rate dropped -27.3% while the murder rate dropped 30.0%. The five full years after Bratton the drop in crime rate performed equally or less well than the two full years under Bratton.
Year-to-Year Changes in the Violent Crime and Murder Rates, from 1990 to 2001. The figures from 1991 through 1999 were adjusted to account for a linear population growth from 1990 to 2000. Note the murder rate increased over the final three years.
The Cumulative Change in Violent Crime and Murder Rates. As above, adjusted for a linear population growth. The cumulative changes are calculated as 1991 through 1993 in comparison to 1990, and as 1994 through 2001 in comparison to 1993 (Dinkins' final year).

My personal verdict so far. Did Giuliani do something right? Yes: he hired Bill Bratton. Did he do something wrong? Yes: he let Bill Bratton go, forcing him out of office.

Giuliani's Final Year.

In David Dinkins final year as mayor, terrorists attacked the World Trade Center, leading to several deaths and thousands of injuries. In Giuliani's final year as mayor, terrorists attacked the World Trade Center leading to thousands of deaths and injuries.

The FBI Uniform Crime Statistics don't include the deaths and injuries from the 2001 attacks. They do include the deaths and injuries from the 1993 World Trade Center attack, the 1995 Oklahoma City attack, in fact, all other terrorist attacks on American soil.

Let's be clear: Giuliani was not behind the 9/11 attacks. Giuliani was not behind any of the 7,175 other murders that took place in New York City when he was mayor. And, of course, Dinkins was not behind the 1993 attack.

Still, the erasure of murders from the counts, just because the number is horrific, is wrong. Giuliani is not responsible for the 9/11 attacks, but is he responsible for any of the deaths or injuries of the 9/11 attacks? This is a thorny issue. A mayor does not only reduce crime through law enforcement, but, among other things, also through making sure street lamps work, and that emergency crews have timely access and coordinated communication. The last of these was a real issue when it came to firefighters hearing the evacuation orders after the first World Trade Center tower fell.

Should the communication have been better? Yes. You can argue that we know that because hindsight is 20/20, but: the buck stops at the mayor's office. Everything he did right to make New York less dangerous has to be weighed with what he didn't do.

As a result of the 9/11 attacks in New York City, 2,753 victims died and an additional 6,294 were treated for injuries at local hospitals. If these were included with Giuliani's statistics, as the World Trade Center attacks were for Dinkins, the murder rate would have reached its peak in 2001 with 43.2 murders per 100,000, an increase of 67.2% over the course of the Giuliani administration. The violent crime would be adjusted to 1040.3 per 100,000, still a healthy decrease of -49.0%.


Martin Hill Ortiz is the author of Never Kill A Friend, Ransom Note Press.


Never Kill A Friend, Ransom Note Press

Never Kill A Friend is available for purchase in hard cover format and as an ebook.
The story follows Shelley Krieg, an African-American detective for the Washington DC Metro PD as she tries to undo a wrong which sent an innocent teenager to prison.

Hard cover: Amazon US
Kindle: Amazon US
Hard cover: Amazon UK
Kindle: Amazon UK
Barnes and Noble