The current wave of COVID-19 cases in the United States greatly exceeds that of the summer peak. Arizona foretold the July wave. Its rate of new cases grew to be 3486 per week per million population, exceeding that of New York state in the early days of the pandemic.
The numbers from the first week in November had 17 states surpassing Arizona at its height. The second week statistics will be much worse. (The reports from some states on the past week's statistics are not available until Monday evening.)
Perhaps the best statistic that illuminates the toll of coronavirus infections is that of hospitalizations for the disease. In several states the number of cases cannot be accurately counted: positivity rates are too high. Even then, case numbers don't reflect the face that a portion of the cases are mild: approximately 20% are asymptomatic. On the other extreme, deaths have occurred in 2.2% of those with a diagnosis of COVID. (Worldometer COVID counts, United States, total deaths divided by total diagnoses.)
As for having a case serious enough for hospitalization, this statistic takes into account the acute morbidity of the disease short of mortality. This statistic connects to the challenges that can overwhelm the hospital system. Coronavirus does not need to kill to produce tragedy. The patient without insurance pays an average of over $73,000 for hospitalization due to COVID-19. Hospitals will lose 323 billion this year due to the pandemic (same source).
The COVID Tracking Project includes graphs for the current COVID-19 hospitalizations for each state. These data are imperfect. One of the great tragedies of the United States response to COVID is that there is still no uniform reporting method.
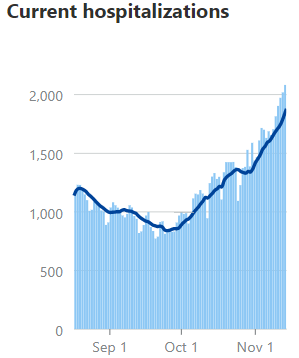
Below, thanks to the COVID Tracking Project, are graphs depicting COVID-19 hospitalizations over time. I have set them in the order of those with the highest rate of cases as of last week. The graphs come from snapshots gathered November 15, 2020, morning and early afternoon.
The solid line is the seven-day running average. The individual bars are the daily counts. With the exception of two or three states where the numbers are near flat or merely hint at rising, there is no good news. Some of the states which have the currently the lowest infection rates are showing dramatic increases.
 |
North Dakota
|
 |
South Dakota
|
 |
| Iowa |
 |
| Wisconsin |
 |
| Nebraska |
 |
| Wyoming |
 |
Montana
|
 |
| Kansas |
 |
| Utah |
 |
| Illinois |
 |
| Idaho |
 |
| Indiana |
 |
| Alaska |
 |
| Missouri |
 |
Colorado
|
 |
| Rhode Island |
 |
| New Mexico |
 |
| Michigan |
 |
| Oklahoma |
 |
| Kentucky |
 |
| Arkansas |
 |
| Nevada |
 |
Ohio
|
 |
| Tennessee |
 |
| Connecticut |
 |
| Alabama |
 |
| Mississippi |
 |
Arizona
|
 |
| Texas |
 |
| New Jersey |
 |
| Pennsylvania |
 |
Massachusetts
|
 |
Florida
|
 |
| West Virginia |
 |
| North Carolina |
 |
| South Carolina |
 |
| Delaware |
 |
| Maryland |
 |
Washington
|
 |
| Virginia |
 |
| Louisiana |
 |
Oregon
|
 |
| Georgia |
 |
| New York |
 |
| California |
 |
| District of Columbia |
 |
| New Hampshire |
 |
| Maine |
 |
| Hawaii |
 |
| Vermont. Some days Vermont had zero hospitalizations. |
Martin Hill Ortiz is a Professor of Pharmacology at Ponce Health Sciences University and has researched HIV for over thirty years.


0 comments:
Post a Comment