Continuing my look at Dow Jones performance, in this post I look at the numbers for each six months in office. This is much more insider information than the previous post and may only be interesting for those who like to go into great detail.
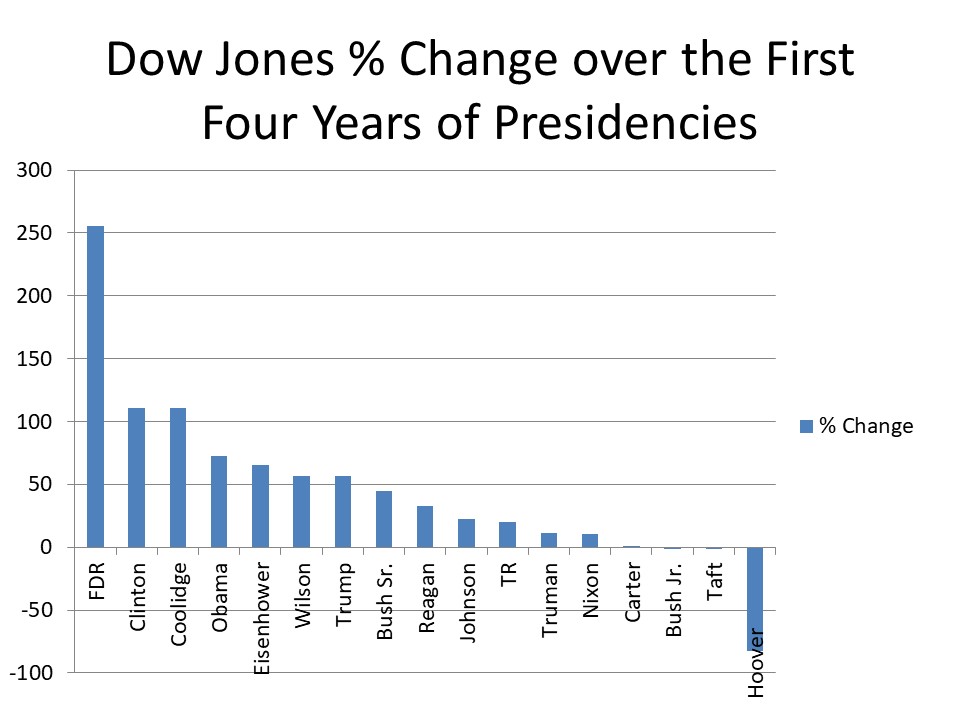 |
| Percent Increase or Decrease in the Dow Jones Industrial Average over the First Four Years of Individual Presidencies. FDR is Franklin Delano Roosevelt. TR is Theodore Roosevelt. |
The Dow Jones has been around in a daily form since May 2, 1885, about seven weeks after Grover Cleveland began his first term. Here is a list of the percent increase in the first six months of each presidency. I included only the first term and for Cleveland, I began with the first index. The website (now defunct) mentioned adjusting the early data (it started as the Dow Jones 12).
For this analysis, I still had the database going back to 1885. I couldn't relocate this database for my other analyses.
The first six months.
Below are the figures of change in the stock market for the first six months. On the one hand, having an equal amount of time for the presidents made the playing field equal. It wasn't like the comparison for full terms which could have been two plus years up to twelve plus. This study and the following ones allowed all the presidents to be included that could not be included in the four year analysis. However, on the other hand, how someone performed in six months wasn't often indicative of how they performed overall. Comparing one six month period to later time points, sometimes presidents did well in a single six month spurt and no other.
Rank, President, (party), %increased/decreased
1. FD Roosevelt (D) +79.4
2. McKinley (R) +34.6
3. Cleveland (D) +22.6
4. Hoover (R) +21.4 (he started off strong)
5. Taft (R) +20.4
6. Truman (D) +17.2
7. Bush Sr. (R) +15.2
8. Coolidge (R) +14.3
9. Obama (D) +11.3
10. Biden (D) +10.3
11. Clinton (D) +9.3
12. Johnson (D) +9.1
13. Trump (R) +9.0
14. Kennedy (D) +7.66
15. B. Harrison (R) +5.14
16. Bush Jr. (R) -0.10
17. Reagan (R) -0.12
18. Wilson (D) -0.6
19. T. Roosevelt (R) -2.8
20. Carter (D) -4.0
21. Eisenhower (R) -6.3
22. Harding (R) -9.5
23. Ford (R) -9.7
24. Nixon (R) -10.4 (six month anniversary date was the same as the first moon landing)
Twelve months. First year.
Here is a list of the percent increase after the first year of each presidency. This didn't include the 19th century presidents.
Rank, President, (party), %increased/decreased
1. FD Roosevelt (D) +96.06%
2. Obama (D) +34.85%
3. Trump (R) +31.49
4. Truman (D) +30.59%
5. Johnson (D) +25.19
6. Clinton (D) +19.81%
7. Bush Sr. (R) +19.80
8. Coolidge (R) +17.10%
9. Harding (R) +15.11%
10. Taft (R) +13.48%
11. Biden (D) +11.90%
12. Kennedy (D) +10.46
13. Ford (R) +4.19
14. Wilson (D) +1.83%
15. Eisenhower (R) +0.4%
16. T. Roosevelt (R) -1.42%
17. Bush II (R) -7.70
18. Reagan (R) -11.02%
19. Hoover (R) -12.86% (it would go a lot lower)
20. Nixon (R) -16.47
21. Carter (D) -18.28%
Eighteen months.
Here is a list of the percent increase (or decrease) in the first year-and-a-half of each presidency.
Rank, President, (party), %increased/decreased
1. F. Roosevelt (D) +71.4%
2. Coolidge (R) +37.0%
3. Harding (R) +35.4%
4. Bush I (R) +32.5
5. Obama (D) +28.7%
6. L. Johnson (D) +28.5%
7. Trump (R) +26.4%
8. Ford (R) +22.0%
9. Eisenhower (R) +17.2%
10. Clinton (D) +15.0%
11. Truman (D) +7.2%
12. Biden (D) +2.8%
13. Taft (R) -3.8%
14. T. Roosevelt (R) -4.4%
15. Kennedy (D) -9.1%
16. Wilson (D) -11.5%
17. Reagan (R) -12.3%
18. Carter (D) -12.6%
19. Nixon (R) -21.2%
20. Hoover (R) -24.8%
21. Bush II (R) -26.5%
Twenty-four months (2 years).
Rank, President, (party), %increased/decreased
1. F. Roosevelt (D) +90.5%
2. Coolidge (R) +54.0%
3. Obama (D) +48.7%
4. Harding (R) +39.3%
5. Eisenhower (R) +36.5%
6. L. Johnson (D) +33.1%
7. Ford (R) +26.4%
8. Trump (R) +24.6%
9. Clinton (D) +19.4%
10. Bush Sr. (R) +18.4%
11. Reagan (R) +12.6%
12. Truman (D) +8.4%
13. Biden (D) +6.6%
14. Kennedy (D) +6.0%
15. T. Roosevelt (R) -21.7%
16. Wilson (D) -5.3%
17. Taft 0% (R) (59.92 on March 4, 1909. 59.92 on March 4, 1911)
18. Nixon (R) -8.7%
19. Carter (D) -12.7%
20. Bush II (R) -18.9%
21. Hoover (R) -42.3% (it would go a lot lower)
Thirty months.
Rank, President, (party), %increased/decreased
Compared to the previous lists Gerald Ford and Warren Harding did not make the two-and-one-half-year list.
1. F. Roosevelt (D) +146.3%
2. Coolidge (R) +79.1%
3. Eisenhower (R) +59.1%
4. Obama (D) +58.2%
5. Clinton (D) +43.7%
6. Trump (R) +37.0%
7. Wilson (D) +36.5%
8. Bush Sr. (R) +34.9%
9. Reagan (R) +29.2%
10. Johnson (D) +23.2%
11. Truman (D) +14.2%
12. Kennedy (D) +9.4%
13. Taft (R) -5.3%
14. Bush Jr. (R) -6.0%
15. Carter (D) -13.6%
16. Nixon (R) -21.2%
17. T. Roosevelt (R) -28.8%
18. Hoover (R) -57.7%
Thirty-six months (3 years).
Rank, President, (party), %increased/decreased
1. F. Roosevelt (D) +191.0%
2. Coolidge (R) +85.1%
3. Eisenhower (R) +61.3%
4. Obama (D) +60.0%
5. Clinton (D) +59.9%
6. Wilson (D) +55.1%
7. Trump (R) +48.0%
8. Bush Sr. (R) +45.6%
9. Reagan (R) +32.4%
10. Truman (D) +13.0%
11. Johnson (D) +11.7%
12. Taft (R) +1.0%
13. Bush Jr. (R) -0.1%
14. Nixon (R) -2.25%
15. Carter (D) -9.06%
16. T. Roosevelt (R) -15.1%
17. Hoover (R) -72.6%
I haven't performed a three-and-a-half months analysis. This would be interesting in part because it captured a picture of near-peak stock market turmoil during the COVID-19 crisis.
In contrast to the previous post with the overall performance after the first four years of the administrations, these numbers show how variable one six month period could be compared to the next. Some presidents who performed well early on, ended poorly (Hoover). Some who began poorly, ended well (Reagan). Several presidents did poorly only in their first quarter and then came back to break even (Carter).
With so many factors in play it is difficult to determine what are the causes behind the varied performances. Clinton who had one of the best performances had the best record of lowering the yearly deficit over his administration, finishing with a surplus. Franklin D. Roosevelt greatly increased government spending and had remarkable increases. Trump set a record in yearly deficit (3.31 trillion in 2020) and had a good year.
I hope in these analyses I provided some perspective to presidential performances in the stock market. It is easy for the media to exaggerate the upside or downside of particular administrations.
Next up, I will look at how presidents ran into or avoided recessions and depressions.
Martin Hill Ortiz is also the author of over 45 short stories, three novels, and one novella. His epic poem, Two Mistakes, won second place in the Margaret Reid/Tom Howard Poetry Competition. He can be contacted at mdhillortiz@gmail.com. His website is mdhillortiz.com.


0 comments:
Post a Comment